Crush The Market Tool

My core investing approach is to only buy stocks that are on the Dividends Aristocrats list. I learned this approach in 2005 when I read the Future For Investors by Jeremy Siegel.

I have not been able to find a stock screening tool that focuses solely on the Dividend Aristocrats, so I built my own and it is below.

Since I will be updating the tool whenever I am doing my own stock analysis, I also placed it in the Tools section of the website.

The table does not display fully in today’s post due to the sidebar.  The horizontal scroll bar is at the bottom.  I made the Crush The Market Tool a single page in the Tools section.  You can see the fill-width table here.

Buy these stocks and you will crush the market.

What the tool does:
– Data goes back to 1/2/1970 if stock was trading
– Data goes back to the first date available if not 1/2/1970
– Accounts for splits and dividends
– Displays the CAGR (Cumulative Annual Growth Rate) for each stock
– Displays the current Dividend Yield %
– Displays the current Annual Dividend in $’s
– Displays the Ex-Dividend Date
– Displays Number of years of stock history
– Can search the entire table
– Can sort any of the columns (Ascending & Descending)
– S&P 500 CAGR is listed at the bottom of the table. I listed the S&P 500 at the bottom of the table since it performs worse than the majority of the Dividend Aristocrats.

How to Use:
– Find the best performing stock? Sort Descending by “CAGR” column.
– Find the highest dividend yield? Sort Descending by “Dividend Yield %” column.
– Find the highest dividend amount ($)? Sort Descending by “Annual Dividend $” column.
– Find when a you need to buy a stock to get the next quarterly dividend payment? Sort Ascending by “Ex-Date” column and add 3 months. Look the stock up on your favorite stock website to find the exact Ex-Dividend Date.
– Find out if you just missed buying a stock to get the next quarterly dividend payment? Sort Descending by “Ex-Date” column and add 3 months. Look the stock up on your favorite stock website to find the exact Ex-Dividend Date.

Company NameTickerNumber of YearsCAGRDividend Yield %Annual Dividend $Ex-Date
AbbVieABBV4.0019.004.192.562017-01-11
Abbott LaboratoriesABT34.0213.202.621.062017-01-11
Archer-Daniels-Midland CoADM34.029.902.681.202016-11-14
Air Products & Chemicals Inc.APD34.0213.102.212.282016-12-07
AFLAC Inc.AFL33.0217.002.451.722016-11-14
Automatic Data ProcessingADP34.0212.302.353.442016-12-29
C. R. BardBCR34.0212.600.4491.042017-01-19
Becton DickinsonBDX34.0213.801.692.922016-12-07
Franklin ResourcesBEN35.0223.102.00.802016-12-28
Bemis CompanyBMS33.0212.602.331.162016-11-14
Cardinal Health Inc.CAH30.0217.002.401.802016-12-29
Cincinnati Financial CorpCINF29.0210.905.463.842016-12-19
Colgate-PalmoliveCL40.0311.402.301.562017-01-19
The Clorox CompanyCLX34.0214.102.643.202016-10-24
Cintas CorpCTAS28.0212.804.675.322016-11-02
Chevron Corp.CVX46.037.303.744.322016-11-16
Dover CorpDOV32.0210.402.231.762016-11-28
Ecolab IncECL29.0214.201.251.482016-12-16
Consolidated Edison IncED46.0310.103.672.682016-11-14
Emerson ElectricEMR45.039.603.261.922016-11-08
Genuine Parts CompanyGPC34.0210.802.642.632016-12-07
W. W. GraingerGWW33.0213.201.984.882016-11-09
HCPHCP33.0211.604.921.482016-11-08
Hormel Foods CorpHRL27.0213.201.90.682017-01-12
Illinois Tool WorksITW33.0212.702.102.602016-12-28
Johnson & JohnsonJNJ46.0312.802.803.202016-11-18
Kimberly-ClarkKMB33.0212.903.173.682016-12-07
Coca-Cola CoKO46.0311.903.391.402016-11-29
Leggett & PlattLEG30.0212.702.851.362016-12-13
Lowe's Companies, Inc.LOW32.0216.301.951.402016-10-17
McDonald'sMCD46.0314.803.083.762016-11-29
MedtronicMDT36.0215.402.291.722016-12-21
McCormick & CompanyMKC40.038.702.011.882016-12-28
3M CompanyMMM46.0310.702.494.442016-11-16
Altria GroupMO46.0320.603.492.442016-12-20
NucorNUE34.0213.602.481.512016-12-28
PepsiCoPEP45.0311.302.923.012016-11-30
Procter & GamblePG46.039.003.062.682017-01-18
Phillip MorrisPM9.0112.004.404.162016-12-20
PentairPNR44.0310.002.311.362016-10-19
PPG IndustriesPPG34.0210.001.621.602016-11-08
Sherwin-WilliamsSHW32.0214.801.183.362016-11-16
Stanley Black & Decker Inc.SWK32.029.601.932.322016-11-30
SyscoSYY44.0315.302.451.322017-01-04
AT&TT33.0210.004.731.962017-01-06
Target CorporationTGT34.0211.003.742.402016-11-14
T. Rowe PriceTROW29.0215.002.932.162016-12-13
VF CorporationVFC32.0210.303.241.682016-12-07
WalgreensWBA2.006.001.841.502016-11-15
WalmartWMT45.0317.502.982.002016-12-07
Exxon Mobil CorpXOM46.0310.003.493.002016-11-08

Benchmark: S&P 500 CAGR since 1/3/1970 is 7.02%. All but one stock in the above list have beaten the S&P 500 since 1970.

Thanks for stopping by and hope the post has been helpful.

Posted in Dividends, Investing, Stocks | Leave a comment

Failure Porn

I wish I could take credit for the phase but I heard it when listening to a James Altucher podcast.  Basically, we all tend to pull out our mistakes, look at them, and start stringing them all together.  And you can get addicted to looking at your failures. Don’t get carried away and frame up all of your past efforts by only looking at mistakes.

Sometimes I feel like I’m running the most successful studio in the world. I’ve got a lot of failures I can pull out of the vault and relive. They aren’t really  failures though. They are more like experiences.  I learn from every one of them and it helps me be a better investor.

So let’s look at one from last year. Red is bad, green is good.  There is no green.

I lost $6,554 in about 6 months. A negative 39.9% return. Brutal.

This is what happens when I stray away from Dividend Aristocrats.  I also did not set a stop on this stock to protect myself from losses.  I should know better by know after all these years. I still have failures and you will too. Hopefully they will become experiences for you as well as you learn your own investment behaviors and style.  Even better, learn from my mistakes and don’t make them.

Thanks for stopping by and hope the post has been helpful.


Posted in Dividends, Investing, Stocks | Leave a comment

Look At Your Portfolio Every Day

Yes, I am serious. Actually, look at it multiple times a day. As a dividend growth investor, you will need to get used to your capital moving a lot. It can move both up and down quite a bit over the course of even a day. When your portfolio gets larger, you will want to be mentally prepared see big swings in capital. And here’s the kicker, you should be happier when it goes down. What? Yes, when it goes down you will be able to buy more shares which results in more dividend income. Again, the goal is to live off of the dividends and never touch the capital itself. Even if you are not actively investing more of your own capital, you will likely still be buying more shares with dividend reinvestment.  You want to reinvest dividends cheap too.

Here’s a couple analogies:
If you were buying steak at the grocery store, would you be happier when the price increased $2 per pound or would happier when the price went down and is on sale by $2 per pound? Remember, you are buying steak, not selling.

If you owned a house, it was rented, and generating a steady income stream, would you sell the house if it increased 10%? Would you sell the house if went down 10%. Since you originally got into real estate for income generation, you would likely just keep the house and the income stream.

To this day, I still can’t help but get a little happy when I see the green on an up day and a little upset when I see red on a down day. Just look at your portfolio, think about how you feel, but don’t touch. It’s a behavior I am still trying to master and definitely requires a lot of practice. It’s fun to watch when it goes up, but I get more excited when it goes down and I have capital waiting to buy more shares and get more dividends and more income.

Thanks for stopping by and I hope the post helps.

Posted in Dividends, Stocks | 5 Comments

It Pays Dividends

Dividend: A dividend is a payment made by a corporation to its shareholders, usually as a distribution of profits, straight from Wikipedia.

Let me show you what a quarterly dividend payment looks like with real numbers from one of my stocks.

MO (Altria) is paying $2.44 annually per share owned.  That works out to be $0.61 every 3 months or quarter.

Here is what it looks like as it goes into my account.  It’s pretty simple and straight forward math, but I confused about it before I got educated.  I wanted to demystify that process for you and show you with real numbers in a real account.

Before Dividend Reinvestment

Shares owned x quarterly dividend = cash deposit

8,318.9317 x $0.61 = $5,074.55

Monthly income is $5,074.55 / 3 = $1,691.52.  I like to look at the payments in monthly terms since that is how I think about my regular salaried income.

Cash Getting Deposited

Dividend Reinvestment Share Purchase

Number of Shares In Account After Dividend Reinvestment

Next quarter dividends will be 8,393.6426 x $0.61 = $5,120.12.  And that’s just from reinvesting the dividends.  For the last 47 years, the big changes comes at the end of August every year and I’ll show you that when we get there this year.

Since I’m after income, dividends are what really matter, not the stock price itself.

Slow and steady.  Patience.  Time.  Consistency.

Every time I read the book, the tortoise wins.

Thanks for stopping by and I hope the post helps.

Posted in Dividends | 4 Comments

How Do You Beat The Market So Often?

After reading The Future For Investors by Jeremy Siegel in 2005, I bought a little bit of Phillip Morris.  PM was the number 1 stock in his book over the study period from 1957 – 2003, about 46 years.  At the end of 2011, I did a review of our portfolio and realized how bad it sucked from 2000 to 2011.  We had stocks like Cisco, Microsoft, Home Depot, Starbucks, and a ton of the S&P 500 index in our portfolio.  You can see just how bad 2000 – 2011 was by looking at the graphic at the top of the page.

Wait a minute, what are these two stocks?  PM and MO (Altria) were doing very well.  I clicked on the “lots” under those stocks and saw a bunch of little purchases every 3 months.  Not only was I getting more shares through dividend reinvesting, PM and MO also had better returns than those other dogs I mentioned above.  The research that Jeremy Siegel had done still held up from 2003 – 2011.  It was then I decided to quit playing with stocks and pick real winners.  You can see that strategy is still holding up over here.  These winners are known as the Dividend Aristocrats.  They have a history of paying increasing dividends for the last 25 years.  You can see the list and read more here.

So here is what we most of our portfolio (had some mistakes mixed in) has been made up of since 2012 when we moved into our current broker.

Altria – MO

Phillip Morris – PM

ConocoPhillips – COP

Merck – MRK

That’s it.  We only have 4 highly quality stocks.  PM and MO are not on the Dividend Aristocrats list due to PM spinning off MO in 2008.  ConocoPhillips (COP) is not on there either and we are losing on that one.  Merck (MRK) was on Jeremy Siegel’s original list, but is not a Dividend Aristocrat any more due to not increasing their dividend in the mid 2000’s.  We sold MRK off on 7/18/2016.  We only have .91 shares of MRK now.

Thanks for stopping by and I hope you found the post helpful.

Posted in Investing, Stocks | 6 Comments

Year By Year Portfolio Stats

First, let me tell you why I am posting this.  When I am reading other sites, it helps me see how they did it with real numbers.  It triggers something inside me and it just makes it more real or doable.  I wanted to add to that community.  I hope this helps you see that it can be done and triggers action for you like it did for me when reading the other sites.  In other posts, I will detail some instructions on how to do it.  I have some dividends rolling in later this week so I can show you the what that looks like.

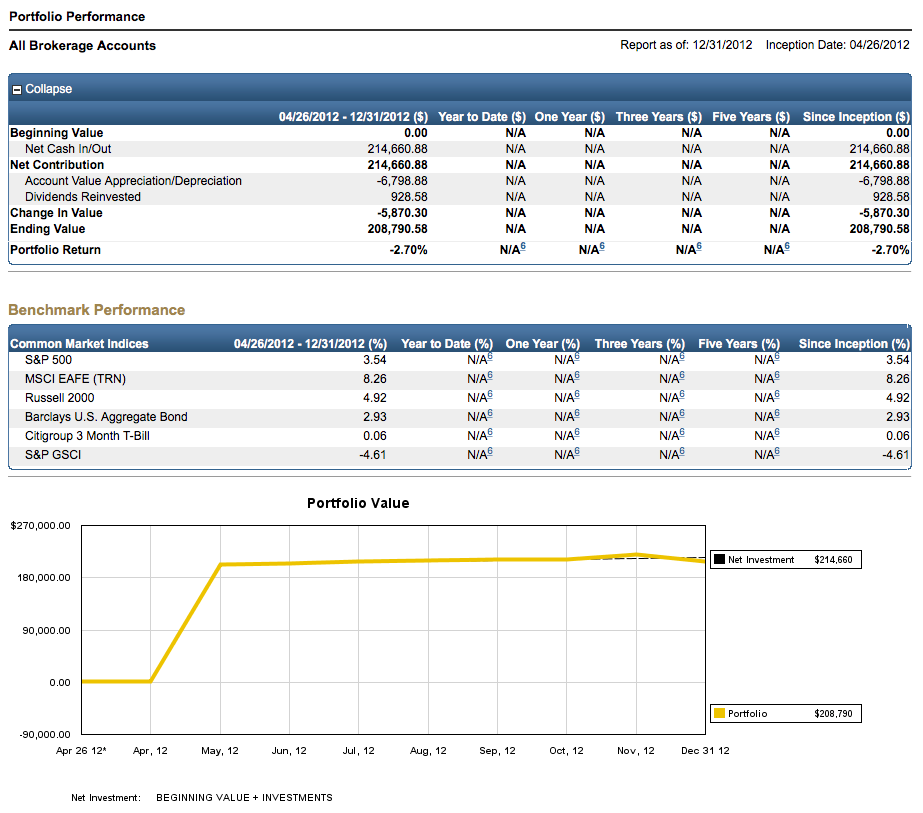
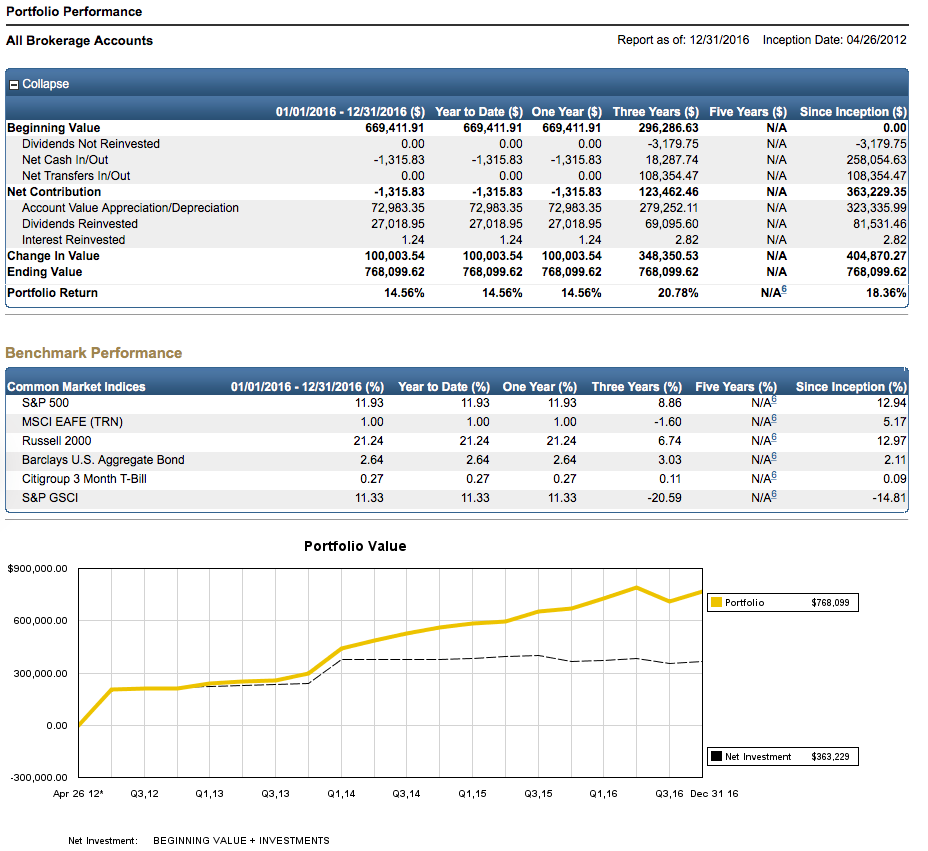
Summary Since Inception – 4/26/2012

Savings$363,229.35
Change in Value$404,870.27
Value$768,099.62
Total Dividends$81,531.46
Rate of Return Since Inception18.36%

As you read below, I really want you to pay attention to the dividends each year.  Dividend growth is really what we are after.  I’d honestly prefer the stocks I hold  to have gone down so I could buy more shares to throw off more dividends.

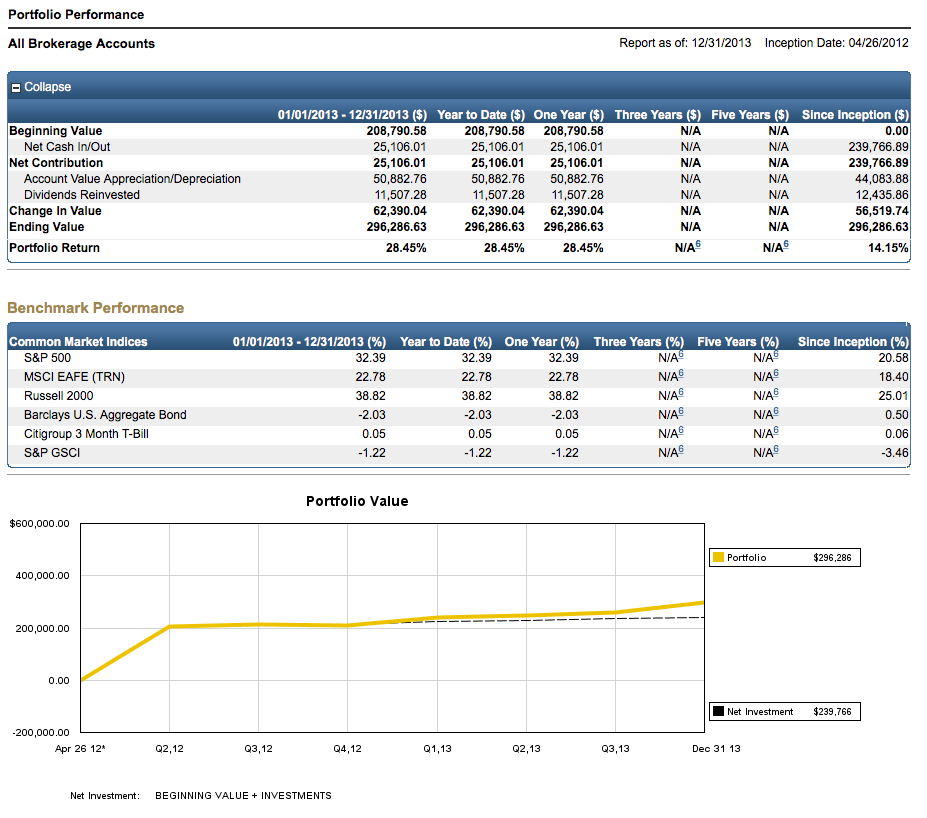
Keep an eye on the “Since Inception” column each year.  The chart (with yellow and black lines) at the bottom of year shows savings (black) charted with portfolio value (yellow).  Portfolio value = stock price X number of shares.

Click on each picture to see larger one.

Terms

Dividends Not Reinvested – Dividends I received, but did not reinvest.  Probably because I forgot to check the “reinvest dividends” when I bought the stock.  I was still learning the mechanics.
Net Cash In/Out – Money transferred in or out from another brokerage account.
Net Transfers In/Out – Savings or withdrawals of money.  I’ve done both over the last 5 years.
Account Value Appreciation/Depreciation – Amount the stock in the accounts have gone up or down based on stock market returns.  Does not include dividends.
Dividends Reinvested – Dividends we received and reinvested.
Interest Reinvested – Gains from cash sitting in account.  Pays like .01% money market rate.  Terrible.

2012

A couple people at work told me about an option we had to self direct our 401k.  Basically, we can buy mutual funds and individual stocks.  Individual stocks pay dividends.  I start moving money in.   Dividends recieved: $928.58.  Exactly $77.38 a month.

2013

A really good year for the market.  I lost to the S&P 500 this year 28.45% to 32.39%.  I’ll still take 28.45% for any year.  Dividends recieved: $11,507.28.  Almost $1,000 a month.

2014

I flat out whipped the S&P 500 this year, 26.80% to 13.69%.  The portfolio is really starting to take off now, yellow line separating from black line.  I really like the brokerage firm I’m using so I consolidate all other accounts shown on the Net Transfers In/Out line, transferred  $108,354.17.  Mentally, I also really like being able to see the entire stash all in one place.  Dividends recieved: $18,416.53.  Over $1,500 a month.

2015

I don’t know what to even call what I did to the S&P 500, 21.32% to 1.38%.  Killed it! Notice the drop on the black line below.  We had to pull out $43,328 for a relocation that did not work out.  I’m pointing out that life happens.  I also realize that we could pay for something like college from here and still see an increase in the stash.  Dividends recieved: $23,660.12.  Almost $2,000 a month.

2016

Beat the S&P 500 a little bit, 14.56% to 11.93%.  I strayed away from my fundamental investing approach and got killed.  I won’t do that again.  We also pulled out $33,000 to pay off 2 cars.  I thought I hated letting go of part of the stash more than debt.  I was wrong.  We hate debt more than pulling money from the stash. Especially, after writing the checks each month for about 18 months.  The dip in the 3rd quarter was due to one of my holdings getting clobbered.  I did not sell it and you can see that same holding finished off the end of the year strong.  Reinforces the “think long term” philosophy. Dividends recieved: $27,018.95.  Exactly $2,251.57 a month.   Dividend growth is slower due to my straying from core investing philosophy and one of my holdings is going up, so it’s costing me more to buy more shares.

Thanks for stopping by and I hope you found the post helpful.

Posted in Financial Independence, Net Worth, Our Story | 3 Comments

I Wish I Would Have Bought……

Have you ever wondered how much a stock would be worth today if you had bought some in the past?  You can now with this easy tool, Stock Chocker.  Man, I love the Internet!

It has data that goes back to 1/2/1970, if the stock was around then.  Check it out.  It’s a lot fun. It’s also the website I use to figure out returns from a certain date until now like it did in this post.


Wow!

It’s never too late.  Think about your future, your kids’ future, you’re grandkids’ future.

Have a great weekend!

Posted in Investing, Our Story, Stocks | 4 Comments

Investment Gain Update – 2016 Edition

It always helps me to see real, actual dollar numbers when reading other people’s posts. Something about seeing hard numbers makes it more real. So here are ours. I started with 2012 because that is when we started using Schwab and it’s pretty easy to pull the data together.

These are gains, not the capital itself. I like to look at it this way since it shows what it earned without the distraction of the capital.

YearInvestment Gains
2012-$5,870
2013$62,390
2014$125,788
2015$122,577
2016$100,002

Stats
Total$404,867
Average$80,973

Wait, why do you have negative gains in 2012?  Well, I was moving into individual stocks and changing brokerages to Schwab.  You can see my timing strategy did not work.  That’s okay, it more than recovered in the next 4 years.

Looking at the stats helps me stay focused and validates we are on the right path. If that $80,973 was in a normal brokerage account (not 401k or Roth) and we had $0 of regular income, we could pull that money out tax-free each year…. legally.  Did you say $80,973 in income with $0 in taxes?  Yep, more on that in another post.

Something to think about.

Posted in Investing, Net Worth, Stocks | Leave a comment

Our $1,182,742.41 Mistake

Yep, that’s not a typo or misplaced comma. That is how much we would have as of 1/1/2017 if we would have invested the $200,000 gain from the sale of our house when we sold in December 2005. I definitely did not know what I know now about investing and you can’t change the past. The purpose of looking back and documenting our mistake is to help my kids and others think differently on homeownership. I was reading a couple posts over at Millenial Revolution and it really got me thinking. So I decided to run our scenario.

Invest in Stock Market 
Proceeds from house sale$200,000
Time10 Years
Rate of Return19.21%
Value after 10 years$1,382,742.41
Dividend Yield3.6%
Cash from Dividends (Yield x Value after 10 years)$49,758.20
Monthly income from Dividends$4,146.51

Are you kidding me? We would have $1,382,742.41 in capital generating $49,758.20 annually or $4,146.51 monthly. We could buy 3 of our houses outright according to the latest $404,000 estimate from Zillow. Or that $4,146.51 every month could easily pay our $1,478 mortgage payment and all our utilities….. including a fat cable and internet package.

Hold the phone. I see a problem with your math. You have 19.21% as your Rate of Return. You can’t 19.21% for 10 years, that’s impossible! Oh, you went back and did a search for the best stock return over that time period and used to stack the deck for stocks vs. real estate.

Nope.

We sure did get 19.21% for that 10 year period, just not with that $200,000. We have been buying MO (Altria) since 2005 when I read The Future for Investors: Why the Tried and the True Triumph Over the Bold and the New by Jeremy Siegel. It was actually trading as PM (Phillip Morris) back then. Mr. Siegel use MO for several of his examples in the book and it was the number 1 stock by far since the 1950’s. I figured, what the heck and bought a little MO to get in on the action. MO continues to be the top performer in our portfolio every single year. See the rate of return for yourself on Stock Choker.

We still have the $200,000, it’s just locked up in the house. We can’t get to it until we sell the house. We can’t use it to pay bills. To sell the house we would have to pay roughly $24,000 (6%) in real estate commissions. It also takes a long time to sell a house. We could sell the $1,382,742.41 of MO instantly for $8.95 at Schwab.

Why are you telling me this? Well, I’ve got kids and I don’t want them to make the same mistake we did. There’s got to be a better way. After looking at the math, it may be better to rent to until you have built up the from investments to pay cash.

Posted in Our Story, Real Estate, Stocks | 3 Comments

Why FI?

Freedom. Security. Choices. Fun.  Those are all words that describe Financial Independence to us.

Wouldn’t it be great to have the freedom to choose fun, important work and know that you have the security of a regular income stream?  Now maybe it’s not never have to work again type money, but enough to know that your family will have shelter and food in case a bad situation comes up.

The chart at the top of the page is my actual investable net worth. Basically, all cash and investment assets.  It does not include my house or cars.

Take a look at 2002 on the chart above.  That is where we had a decision to make. MegaCorp was restructuring.  My current position was being eliminated and I was offered a position in a new location…… or a severance package.  My job was our main source of income. We had one child that was two.  We were living in a low cost of living city about an hour away from all of our family.  I still vividly remember that day, decision, and the impacts it had on all of our family. All of this happened during the Christmas holidays.  The decision was not made for more money, career advancement or positive reasons. It was made from a place of fear and survival since we were not FI.

At a time that should be full of happiness and celebration, my ex-wife and I had to tell our families that where were moving several states away and taking their grandchild.

We were still in the process of moving and a few months later, my ex-wife was pregnant with our second child.  Here is another time that should be celebrated and filled with happiness but was overshadowed with sadness due to the upcoming relocation.

Now take a look at the right side of the chart. I am still on my journey to FI, but I have more choices, freedom, and security if we are faced with a similar decision to make today.

For me, that’s why FI.

Posted in Financial Independence, Our Story | 1 Comment