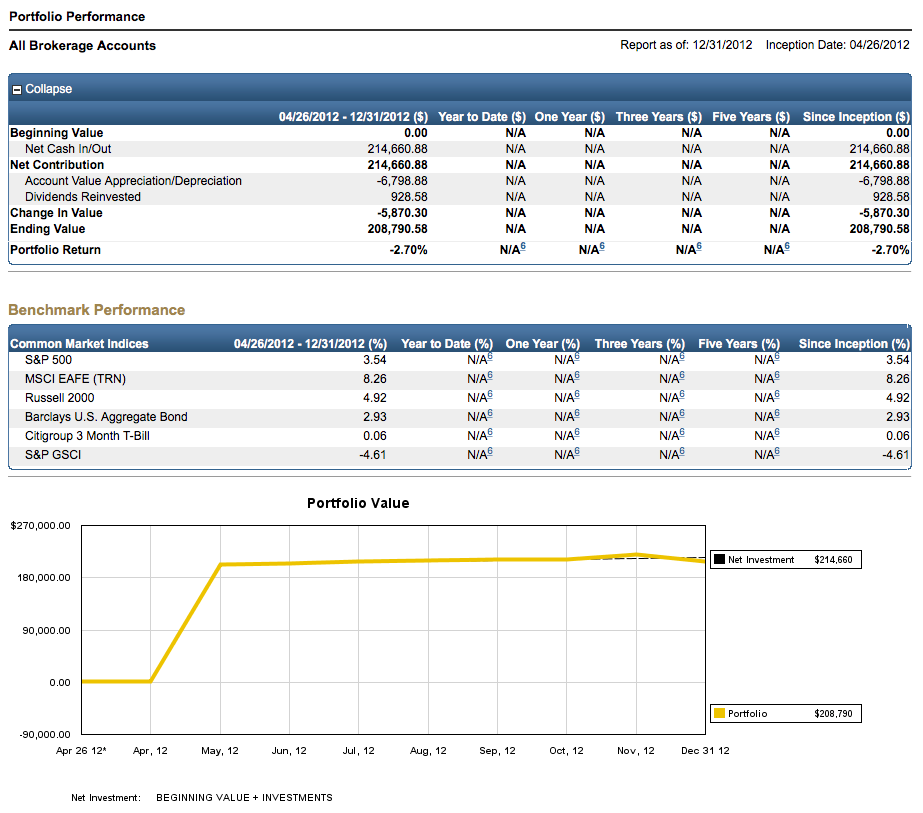
First, let me tell you why I am posting this. When I am reading other sites, it helps me see how they did it with real numbers. It triggers something inside me and it just makes it more real or doable. I wanted to add to that community. I hope this helps you see that it can be done and triggers action for you like it did for me when reading the other sites. In other posts, I will detail some instructions on how to do it. I have some dividends rolling in later this week so I can show you the what that looks like.
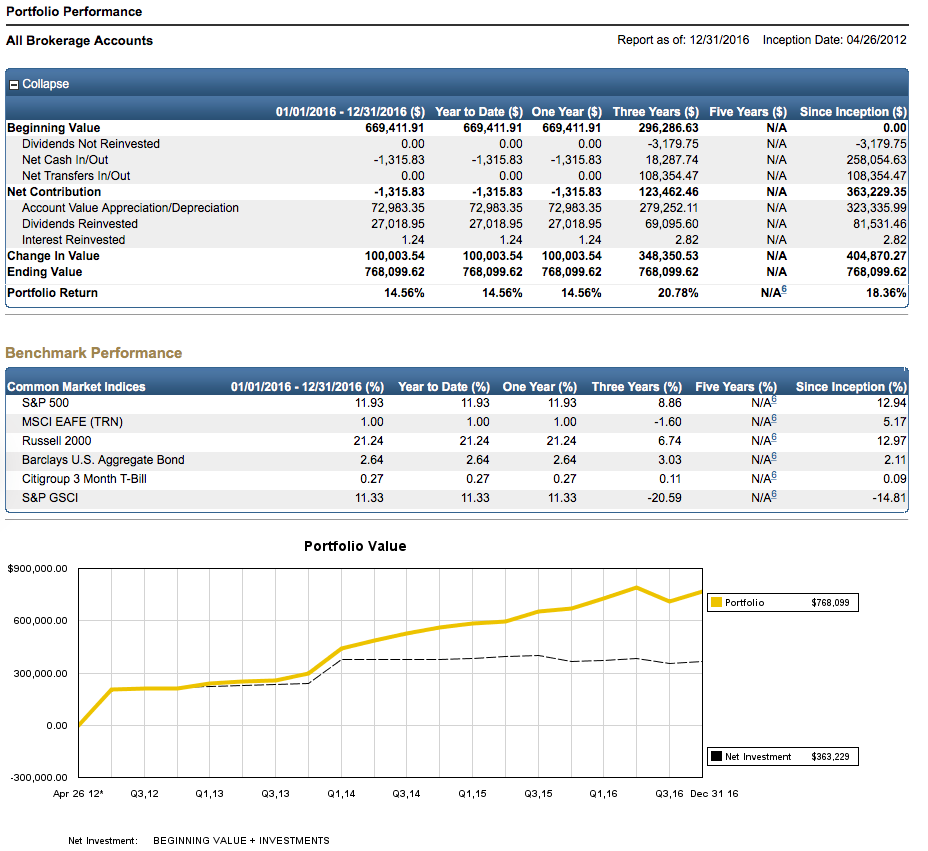
Summary Since Inception – 4/26/2012
| Savings | $363,229.35 |
| Change in Value | $404,870.27 |
| Value | $768,099.62 |
| Total Dividends | $81,531.46 |
| Rate of Return Since Inception | 18.36% |
As you read below, I really want you to pay attention to the dividends each year. Dividend growth is really what we are after. I’d honestly prefer the stocks I hold to have gone down so I could buy more shares to throw off more dividends.
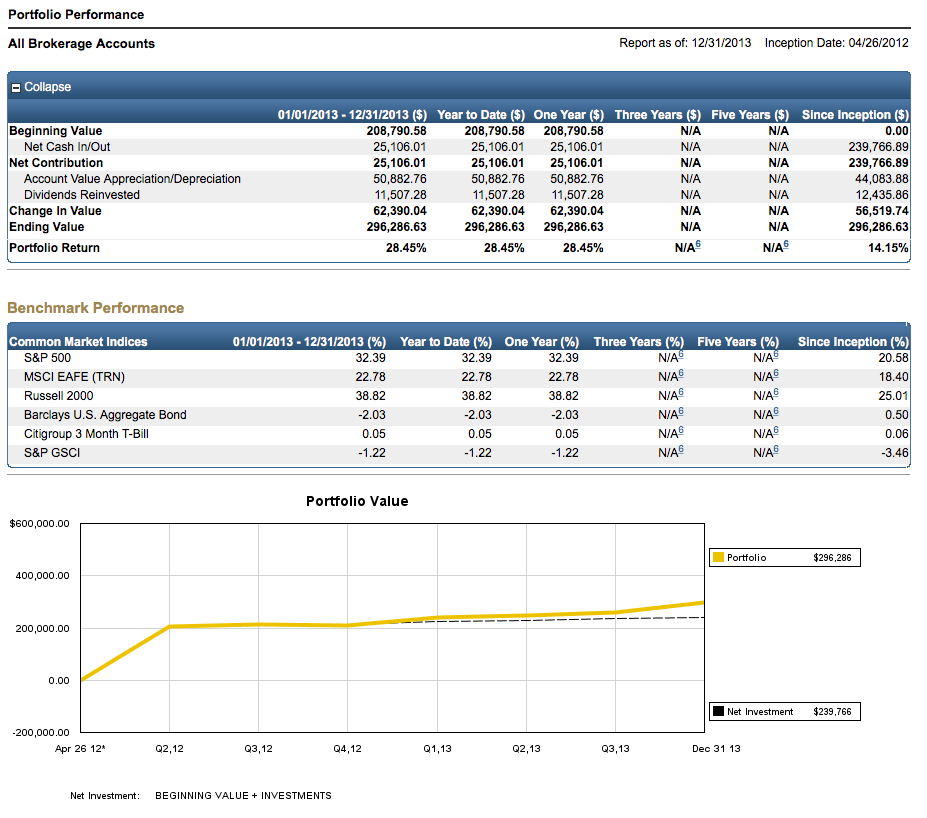
Keep an eye on the “Since Inception” column each year. The chart (with yellow and black lines) at the bottom of year shows savings (black) charted with portfolio value (yellow). Portfolio value = stock price X number of shares.
Click on each picture to see larger one.
Terms
Dividends Not Reinvested – Dividends I received, but did not reinvest. Probably because I forgot to check the “reinvest dividends” when I bought the stock. I was still learning the mechanics.
Net Cash In/Out – Money transferred in or out from another brokerage account.
Net Transfers In/Out – Savings or withdrawals of money. I’ve done both over the last 5 years.
Account Value Appreciation/Depreciation – Amount the stock in the accounts have gone up or down based on stock market returns. Does not include dividends.
Dividends Reinvested – Dividends we received and reinvested.
Interest Reinvested – Gains from cash sitting in account. Pays like .01% money market rate. Terrible.
2012
A couple people at work told me about an option we had to self direct our 401k. Basically, we can buy mutual funds and individual stocks. Individual stocks pay dividends. I start moving money in. Dividends recieved: $928.58. Exactly $77.38 a month.
2013
A really good year for the market. I lost to the S&P 500 this year 28.45% to 32.39%. I’ll still take 28.45% for any year. Dividends recieved: $11,507.28. Almost $1,000 a month.
2014
I flat out whipped the S&P 500 this year, 26.80% to 13.69%. The portfolio is really starting to take off now, yellow line separating from black line. I really like the brokerage firm I’m using so I consolidate all other accounts shown on the Net Transfers In/Out line, transferred $108,354.17. Mentally, I also really like being able to see the entire stash all in one place. Dividends recieved: $18,416.53. Over $1,500 a month.
2015
I don’t know what to even call what I did to the S&P 500, 21.32% to 1.38%. Killed it! Notice the drop on the black line below. We had to pull out $43,328 for a relocation that did not work out. I’m pointing out that life happens. I also realize that we could pay for something like college from here and still see an increase in the stash. Dividends recieved: $23,660.12. Almost $2,000 a month.
2016
Beat the S&P 500 a little bit, 14.56% to 11.93%. I strayed away from my fundamental investing approach and got killed. I won’t do that again. We also pulled out $33,000 to pay off 2 cars. I thought I hated letting go of part of the stash more than debt. I was wrong. We hate debt more than pulling money from the stash. Especially, after writing the checks each month for about 18 months. The dip in the 3rd quarter was due to one of my holdings getting clobbered. I did not sell it and you can see that same holding finished off the end of the year strong. Reinforces the “think long term” philosophy. Dividends recieved: $27,018.95. Exactly $2,251.57 a month. Dividend growth is slower due to my straying from core investing philosophy and one of my holdings is going up, so it’s costing me more to buy more shares.
Thanks for stopping by and I hope you found the post helpful.


Pingback: How Do You Beat The Market So Often? | Financial Independence Warrior
Awesome returns! I like how you show real results and not just a theory in a book.
Thanks Brad! I hope it can help you hit your goals.